


The most popular Amplitude alternatives & competitors, compared

Contents
Amplitude is a solid product analytics platform – it's powerful, mature, and trusted by thousands of companies – but it's not the right fit for every team.
Maybe you need error tracking or LLM analytics that Amplitude doesn't offer. Maybe you're looking for a more developer-friendly platform. Maybe you just want to see what's out there; whatever the case, there are alternatives worth considering.
In this guide, we compare the best Amplitude alternatives across analytics, session replay, experimentation, and more so you can find the right fit for your team and use case.
1. PostHog
- Founded: 2020
- Most similar to: Amplitude, Heap, Pendo
- Typical users: Engineers, product, and growth teams
- Typical customers: Mid-size product-focused B2Bs and startups
What is PostHog?
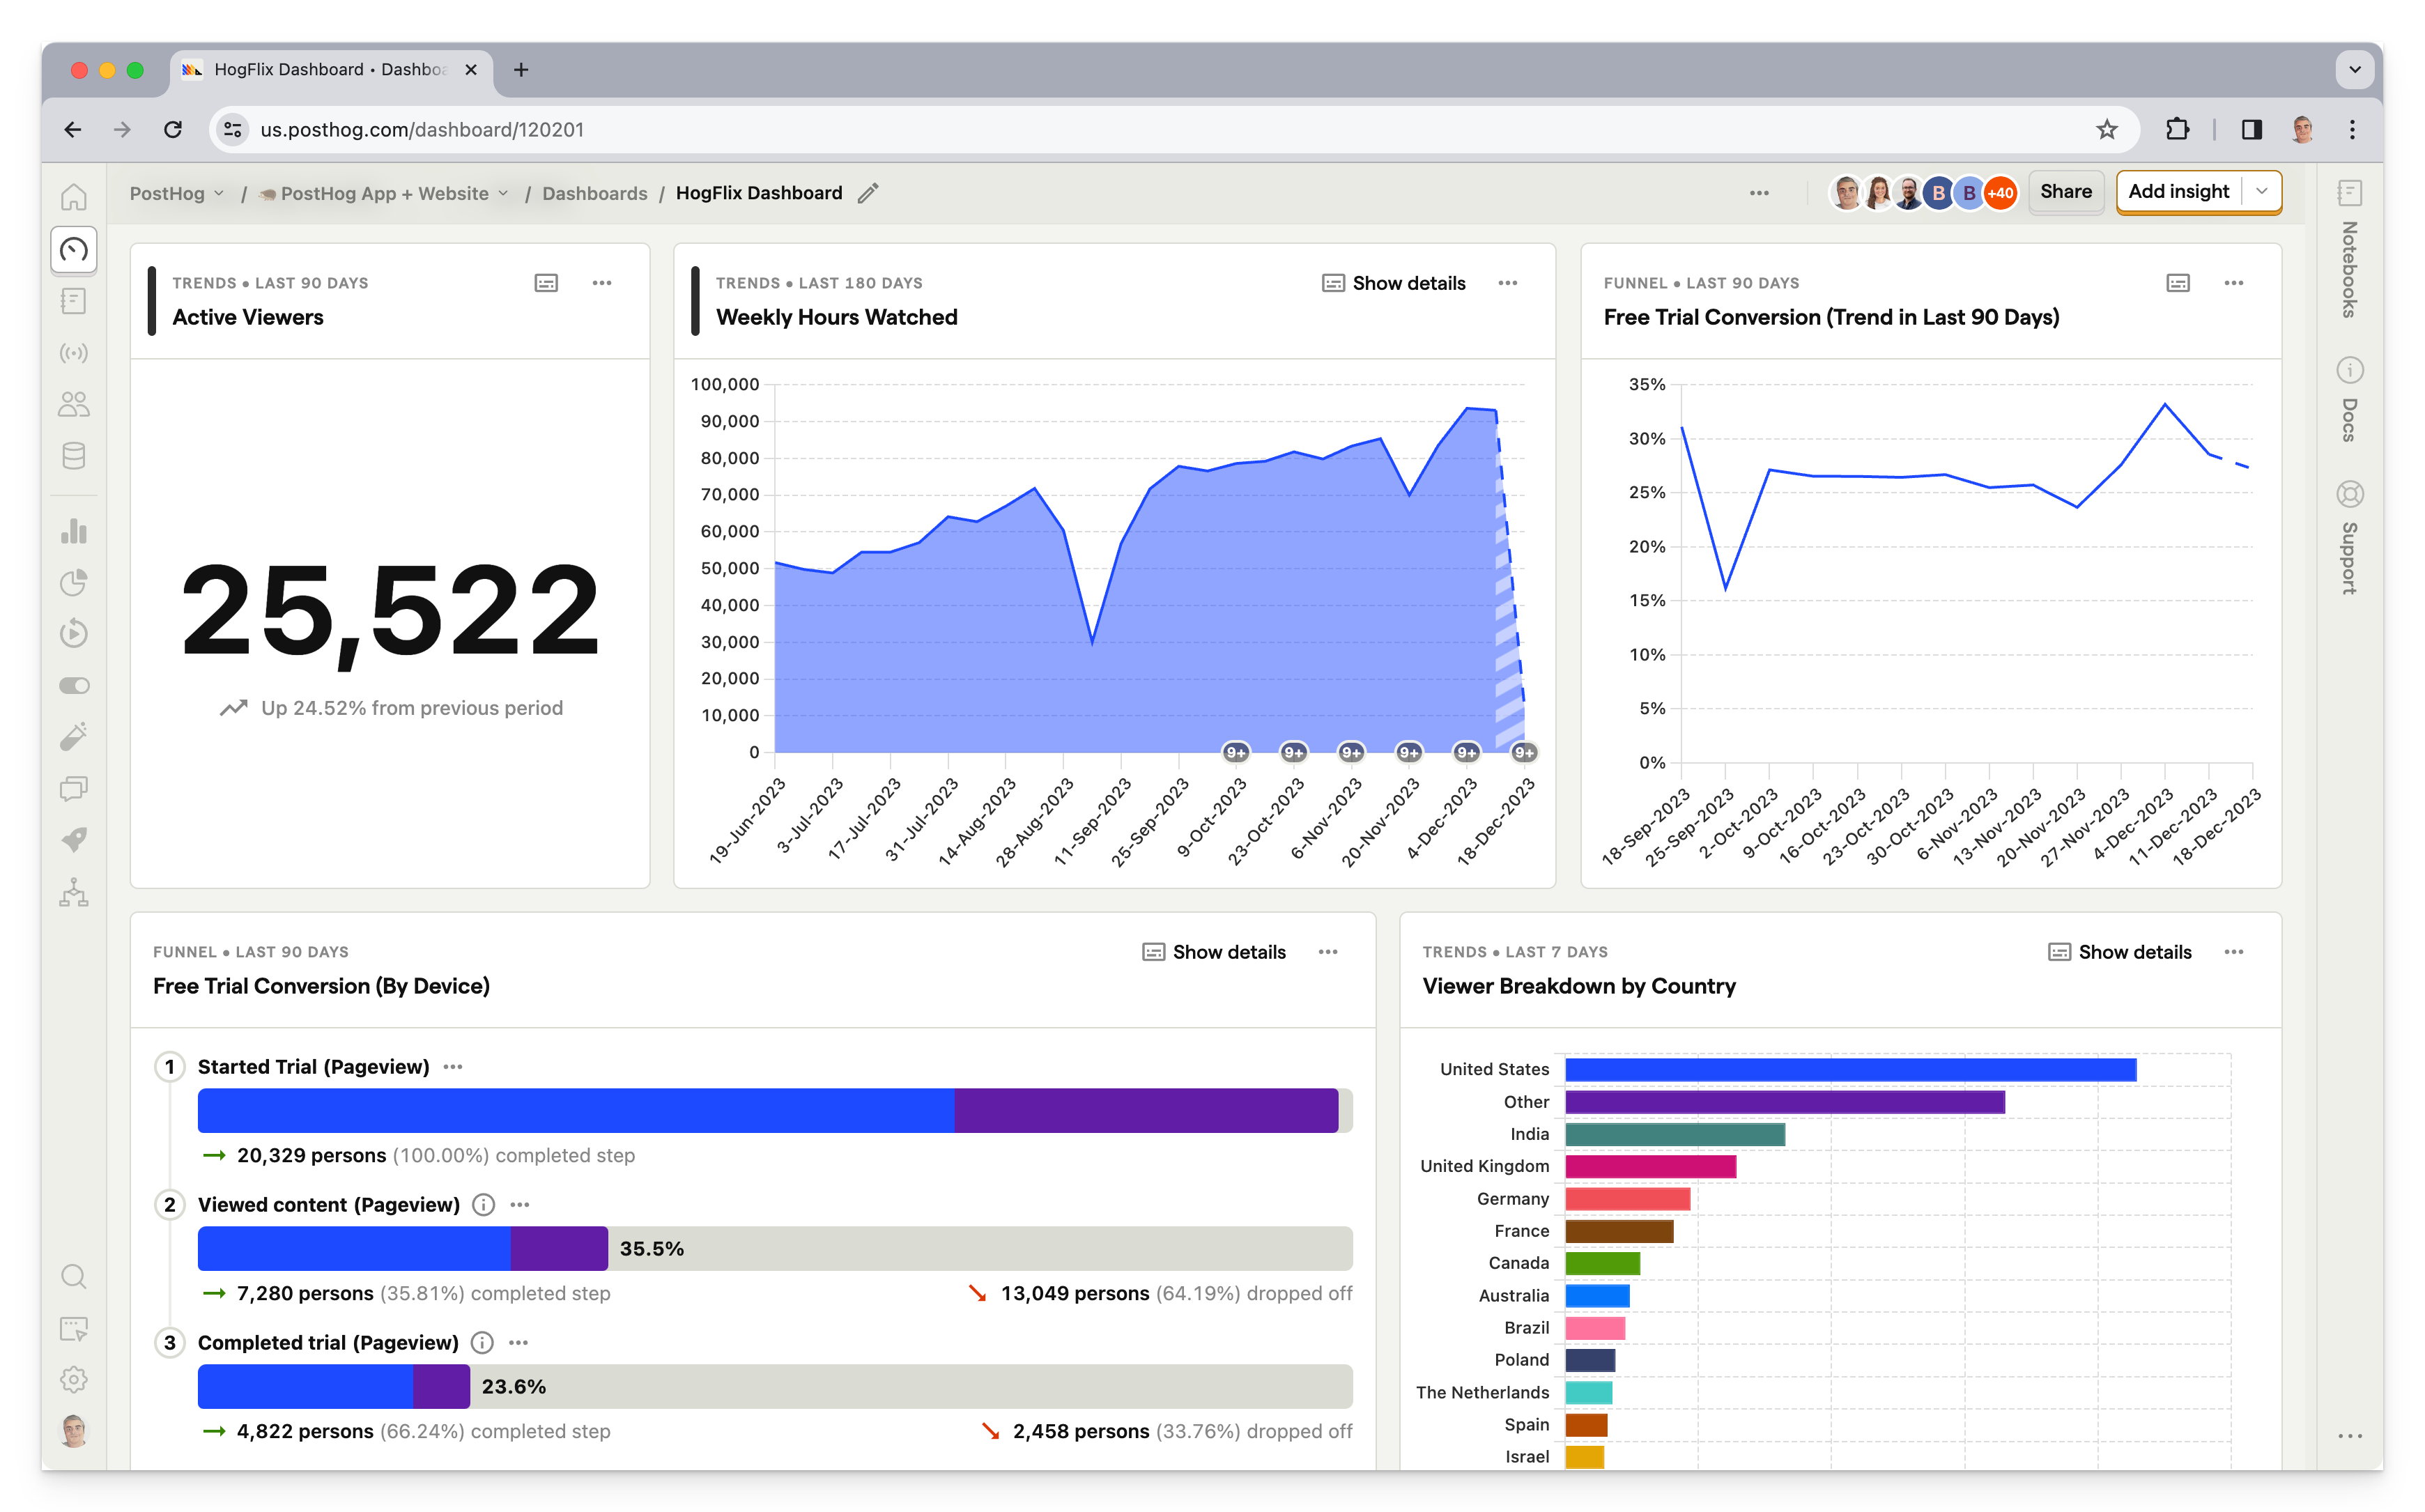
PostHog (that's us 👋) is an all-in-one platform combining product analytics, session replay, feature flags, error tracking, LLM analytics, A/B testing, and user surveys into one product. This means it's not just an alternative to Amplitude, but also tools like LaunchDarkly and FullStory.
Typical PostHog users are engineers, founders, and product managers at startups and mid-size companies, particularly B2B companies. Customers include Supabase, Lovable, ElevenLabs, and many more.
Key features
Product analytics: Funnels, user paths, retention analysis, custom trends, and dynamic user cohorts. Also supports SQL insights for power users.
A/B tests: Up to 10 test variations, primary and secondary metrics. Automatically calculate test duration, sample size, and statistical significance.
Session replays: Including event timelines, console logs, network activity, a DOM explorer, and more with 5,000 free recordings per month.
Surveys: Target surveys by event or person properties. Templates for net promoter score (NPS), product-market fit (PMF) surveys, and more.
Feature flags: Rollout features safely with local evaluation (for faster performance) and JSON payloads.
Error tracking: Monitor exceptions, stack traces, and errors. Connect issues directly to session replays, user behavior, and feature flag changes.
LLM analytics: Track AI product usage, monitor model performance, analyze token costs, and debug LLM interactions.
How does PostHog compare to Amplitude?
Main differences between PostHog and Amplitude
- PostHog uses usage-based pricing (pay per event/replay); Amplitude charges per Monthly Tracked User (MTU).
- PostHog offers 1M events, 5,000 replays, 1,500 survey responses free; Amplitude offers 10K MTUs and 1,000 replays.
- PostHog includes error tracking, LLM analytics, and SQL access; Amplitude lacks error tracking and LLM analytics entirely.
- PostHog is built for engineering-led teams; Amplitude is designed for product and marketing teams.
Main similarities between PostHog and Amplitude
- Both offer product analytics with funnels, retention, cohorts, and user paths.
- Both provide session replay with mobile support (iOS, Android).
- Both are SOC 2 certified and HIPAA/GDPR compliant with EU data residency options.
- Both integrate with major CDPs like Segment and Rudderstack.
Why do companies use PostHog?
According to reviews on G2, companies use PostHog because:
It replaces multiple tools: PostHog replaces Amplitude (analytics), LaunchDarkly (feature flags and A/B testing), and Hotjar (feedback and surveys). This simplifies workflows and ensures all their data is in one place.
Pricing is transparent and scalable: Reviewers appreciate how PostHog's pricing scales as they grow. There's a generous free tier. Companies eligible for PostHog for Startups also get $50k in additional free credits.
They need a complete picture of users: PostHog includes the necessary tools to understand users and improve products. This means creating funnels to track conversion, watching replays to see where users get stuck, testing solutions with A/B/n tests, and gathering feedback with user surveys.
Bottom line
Having all the features of Amplitude (and more) while being free, self-serve, and open source makes PostHog a great alternative. This is especially true for engineering-focused startups and scale-ups as it provides the tools to build a great product.
2. Mixpanel
- Founded: 2009
- Most similar to: Heap, Amplitude, Smartlook
- Typical users: Product managers, designers, and marketing teams
- Typical customers: Mid to large B2C and B2B companies
What is Mixpanel?
Mixpanel is one of the most popular product analytics tools on the market. While it previously deprecated features like A/B testing to focus on core analytics, Mixpanel has reversed course and expanded substantially since 2024. The platform now includes session replay (web and mobile), heatmaps, experiments, and feature flags alongside its core analytics. Teams can connect Mixpanel to their data warehouse, CDP, or instrument directly via SDKs.
Key features
Product analytics: Track user behavior, KPIs, and core metrics with trends, retention, funnels, and flows.
Session replay: Watch real user sessions on web and mobile (iOS/Android), with AI-powered summaries to surface key moments.
Heatmaps: Visualize clicks, scroll depth, and engagement patterns – integrated directly with session replays.
Experiments & feature flags: Run A/B tests with statistical rigor and roll out features safely with native feature flagging.
Metric trees: Map how specific engagement metrics connect to business outcomes and track impact across your product.
Warehouse connectors: Sync data bidirectionally with Snowflake, BigQuery, Databricks, and Redshift.
How does Mixpanel compare to Amplitude?
Mixpanel and Amplitude are the original product analytics platforms and have battled for many years. Both have expanded well beyond core analytics – Mixpanel relaunched experimentation and added feature flags in late 2025, while Amplitude has built out session replay and heatmaps. The two platforms are now more similar than ever.
Main differences between Mixpanel and Amplitude
- Mixpanel charges per event with 1M events free; Amplitude charges per Monthly Tracked User (MTU) with 10K MTUs free.
- Amplitude offers warehouse-native queries directly on your data; Mixpanel syncs bidirectionally but doesn't sit on top of your warehouse.
- Amplitude includes Guides & Surveys as an add-on; Mixpanel doesn't offer native survey functionality.
- Amplitude launched session replay earlier; Mixpanel's is newer but includes mobile support and AI summaries.
Main similarities between Mixpanel and Amplitude
- Both are established product analytics platforms with 10+ years in market.
- Both offer core analytics: funnels, retention, cohorts, and user paths.
- Both provide self-serve plans with free tiers.
- Both integrate with CDPs like Segment and data warehouses like Snowflake and BigQuery.
- Both are SOC 2 compliant with GDPR-ready features.
Why do companies use Mixpanel?
Looking at G2 reviews, companies choose Mixpanel to:
Eliminate the need for data analysts: Mixpanel helps reviewers structure large volumes of data, and make data-driven decisions, reducing their reliance on dedicated data analysts to produce insights.
Track and target campaigns: Marketers appreciate the ability to create user segments and target specific users, enabling more personalized campaigns and improved user engagement.
Understand user behavior: In common with most analytics tools, Mixpanel's users mostly want to understand user behavior, identify bottlenecks, and monitor core metrics like conversion rates, activation, and retention.
Bottom line
Mixpanel has been a top alternative for Amplitude as long as the two have existed. It's great if you only want product analytics, but if you are looking beyond that, there are likely better choices.
3. Pendo
- Founded: 2013
- Most similar to: PostHog, LogRocket
- Typical users: Product managers and customer success teams
- Typical customers: Product-focused small and mid-market B2C apps
What is Pendo?
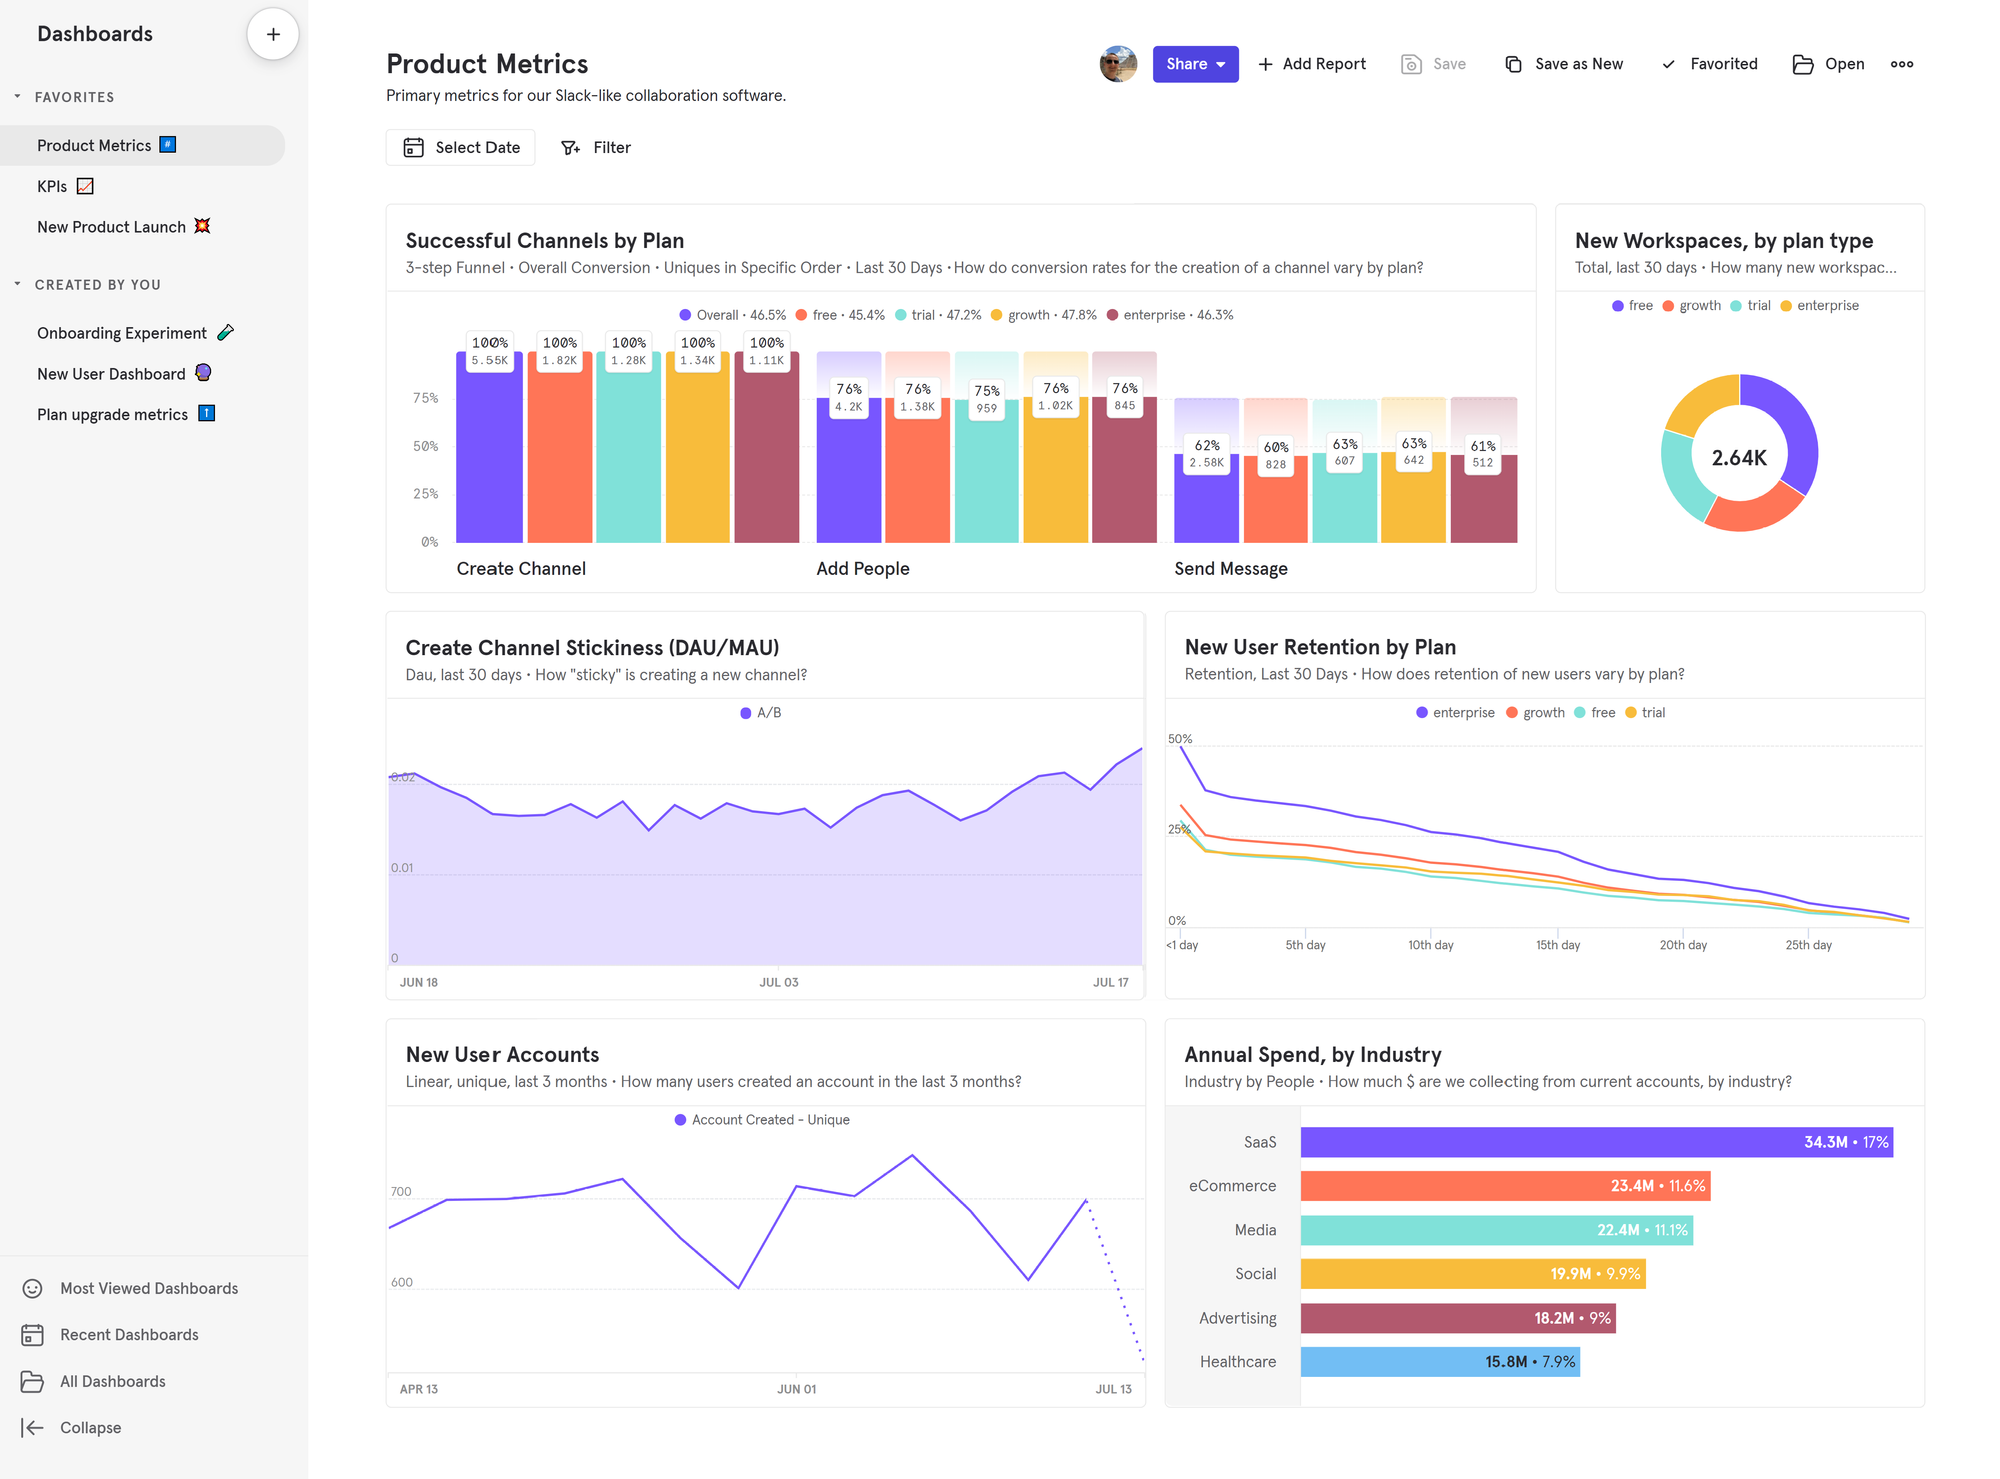
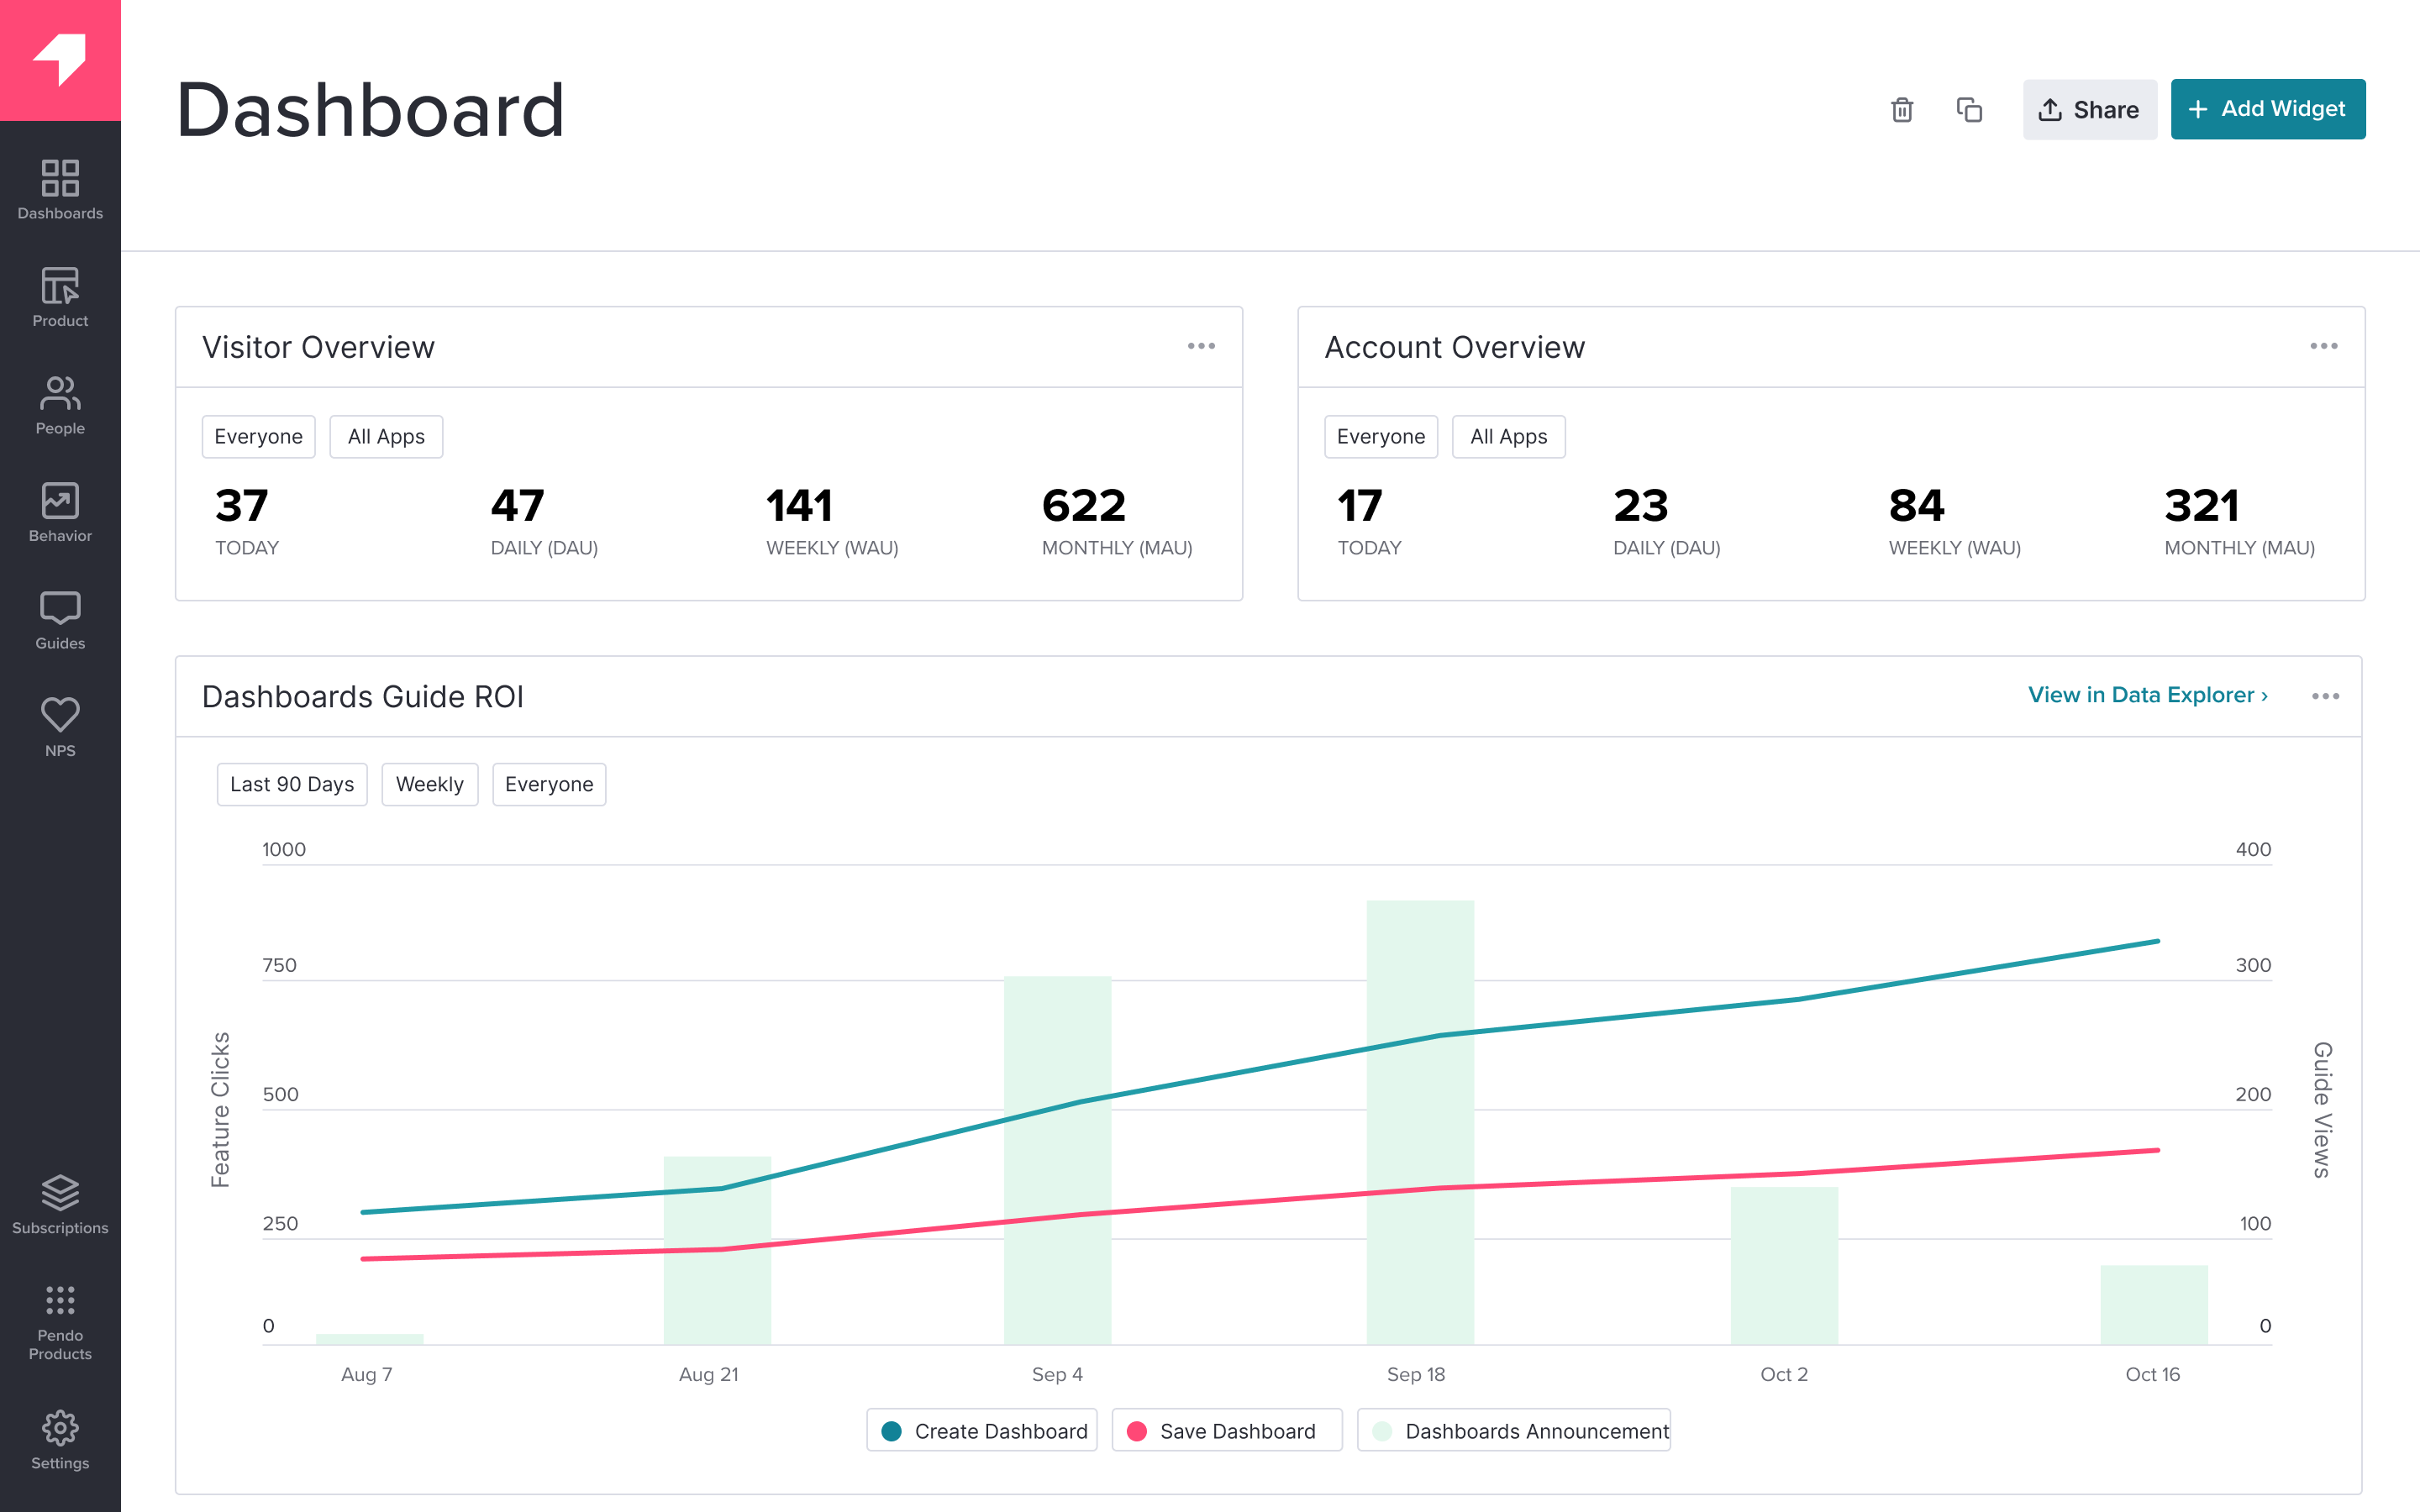
Pendo describes itself as a product experience platform. It helps teams improve their user and custom experience. It does this through the combination of product analytics, session replay, in-app guides, user feedback, and product validation tools.
Key features
Product analytics: Funnels, trends, and retention analysis with event autocapture.
In-app guides: Deliver personalized guidance to customers, directly inside your app.
User feedback: Capture and analyze customer feedback at scale.
Product validation and roadmaps: Plan your product improvements and roadmap using data from Pendo.
How does Pendo compare to Amplitude?
Pendo doesn't have as deep of product analytics functionality and doesn't include A/B testing or experimentation. It focuses more on in-app guides, feedback, and other product tools (which Amplitude doesn't include).
Main differences between Pendo and Amplitude
- Pendo focuses on product experience (guides, feedback, roadmaps); Amplitude focuses on product analytics and experimentation.
- Pendo offers robust product tours and in-app messaging; Amplitude has Guides & Surveys but it's a paid add-on.
- Amplitude includes A/B testing and feature flags; Pendo lacks experimentation features entirely.
- Pendo includes product validation and roadmap planning features; Amplitude doesn't offer roadmap tooling.
Main similarities between Pendo and Amplitude
- Both offer core product analytics with funnels, retention, and user paths.
- Both include session replay for qualitative user insights.
- Both provide survey and feedback collection tools.
- Both are used primarily by product management teams.
Why do companies use Pendo?
According to G2 reviews, customers use Pendo for:
Customer support and feedback: Reviews involved with customer support and feedback collection are big fans of Pendo. They use the feedback features to gather qualitative data and feed that into the validation and roadmap features.
Improved onboarding: The combination of Pendo's in-app guides and analytics features makes it easy for non-technical users to experiment with new onboarding flows. This helps improve user adoption.
Product planning: Reviewers use the data tools, product validation, and roadmap features to align internal teams and stakeholders on product development.
Bottom line
Although Pendo doesn't have the depth in product analytics and A/B testing, the fact that it is free to try, self-serve, and includes session replay makes it a solid alternative to Amplitude.
4. Heap
- Founded: 2013
- Most similar to: PostHog, Glassbox
- Typical users: Product and marketing teams
- Typical customers: B2C SaaS and ecommerce companies with a user experience focus.
What is Heap?
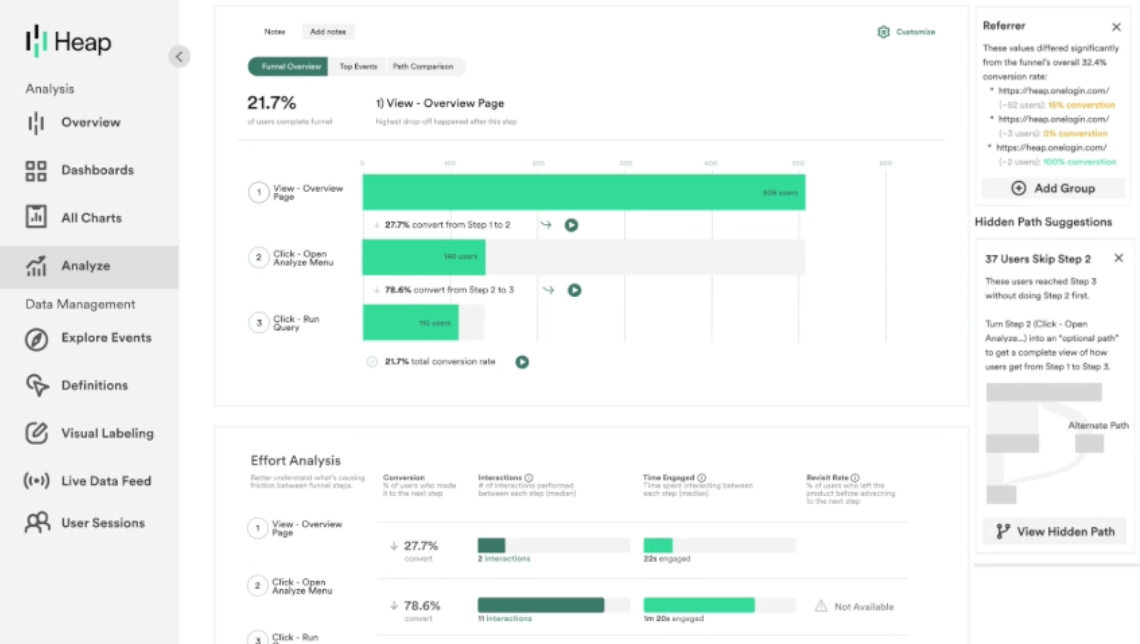
Heap describes itself as a digital insights platform. This means it offers both product analytics and session replay and supports marketing use cases with multi-touch attribution.
Contentsquare, a marketing and ecommerce analytics firm, acquired Heap in September 2023 and announced plans to integrate the two products.
Key features
Event autocapture: Frees product teams from relying on engineers to instrument all events. Heap offers a visual editor for enables teams to tag on-page events for analysis.
Session replay: Get qualitative insights about user behavior by replaying their session (although this lacks the debugging tools typical of most replay tools).
Heatmaps: See where users click, what point they scroll to, and the areas that get the most attention.
Analysis suggestions: Advanced data science capabilities discover hidden interactions, friction points, and knowledge about key paths.
Managed ETL: Connect to data warehouses, so you can combine your analytics with other sources and get a fuller picture of the entire user journey.
How does Heap compare to Amplitude?
Heap's big advantage over Amplitude is autocapture and session replay. If you're interested in A/B testing or EU hosting, Amplitude still has the advantage here though.
Main differences between Heap and Amplitude
- Heap's autocapture is more comprehensive and central to its value prop; Amplitude has autocapture but it's less emphasized.
- Amplitude includes A/B testing and feature flags; Heap lacks experimentation features.
- Heap includes heatmaps out of the box; Amplitude's heatmaps require Session Replay add-on on Growth/Enterprise plans.
Main similarities between Heap and Amplitude
- Both offer core product analytics with funnels, retention, and user paths.
- Both provide session replay for qualitative insights.
- Both integrate with data warehouses like Snowflake and BigQuery.
- Both are self-serve with free tiers available.
Why do companies use Heap?
According to G2 reviews, companies enjoy these three areas of Heap:
Autocapture: Non-technical users love how easy autocapture makes tracking on their site. Along with the element data included, this provides a huge amount of useful analytics data with little setup.
Simple setup: It does not take a big technical effort to set Heap up. Users can add a single script and begin collecting data. They then make it easy to visualize that data through user paths, funnels, and session replays.
Streamlining analysis: By having analytics and session replay data in one place, Heap makes it easy to understand the usage of their app or site. This replaces interviews or user testing and makes the development cycle faster.
Bottom line
For product analytics, Heap is a great alternative to Amplitude thanks to autocapture. It is an especially good choice to try if you prefer session replay to A/B testing, EU hosting, or feature flags.
5. Glassbox
- Founded: 2010
- Most similar to: Heap
- Typical users: Business analysts, product support, marketers
- Typical customers: Enterprise B2C companies, retail, and financial services
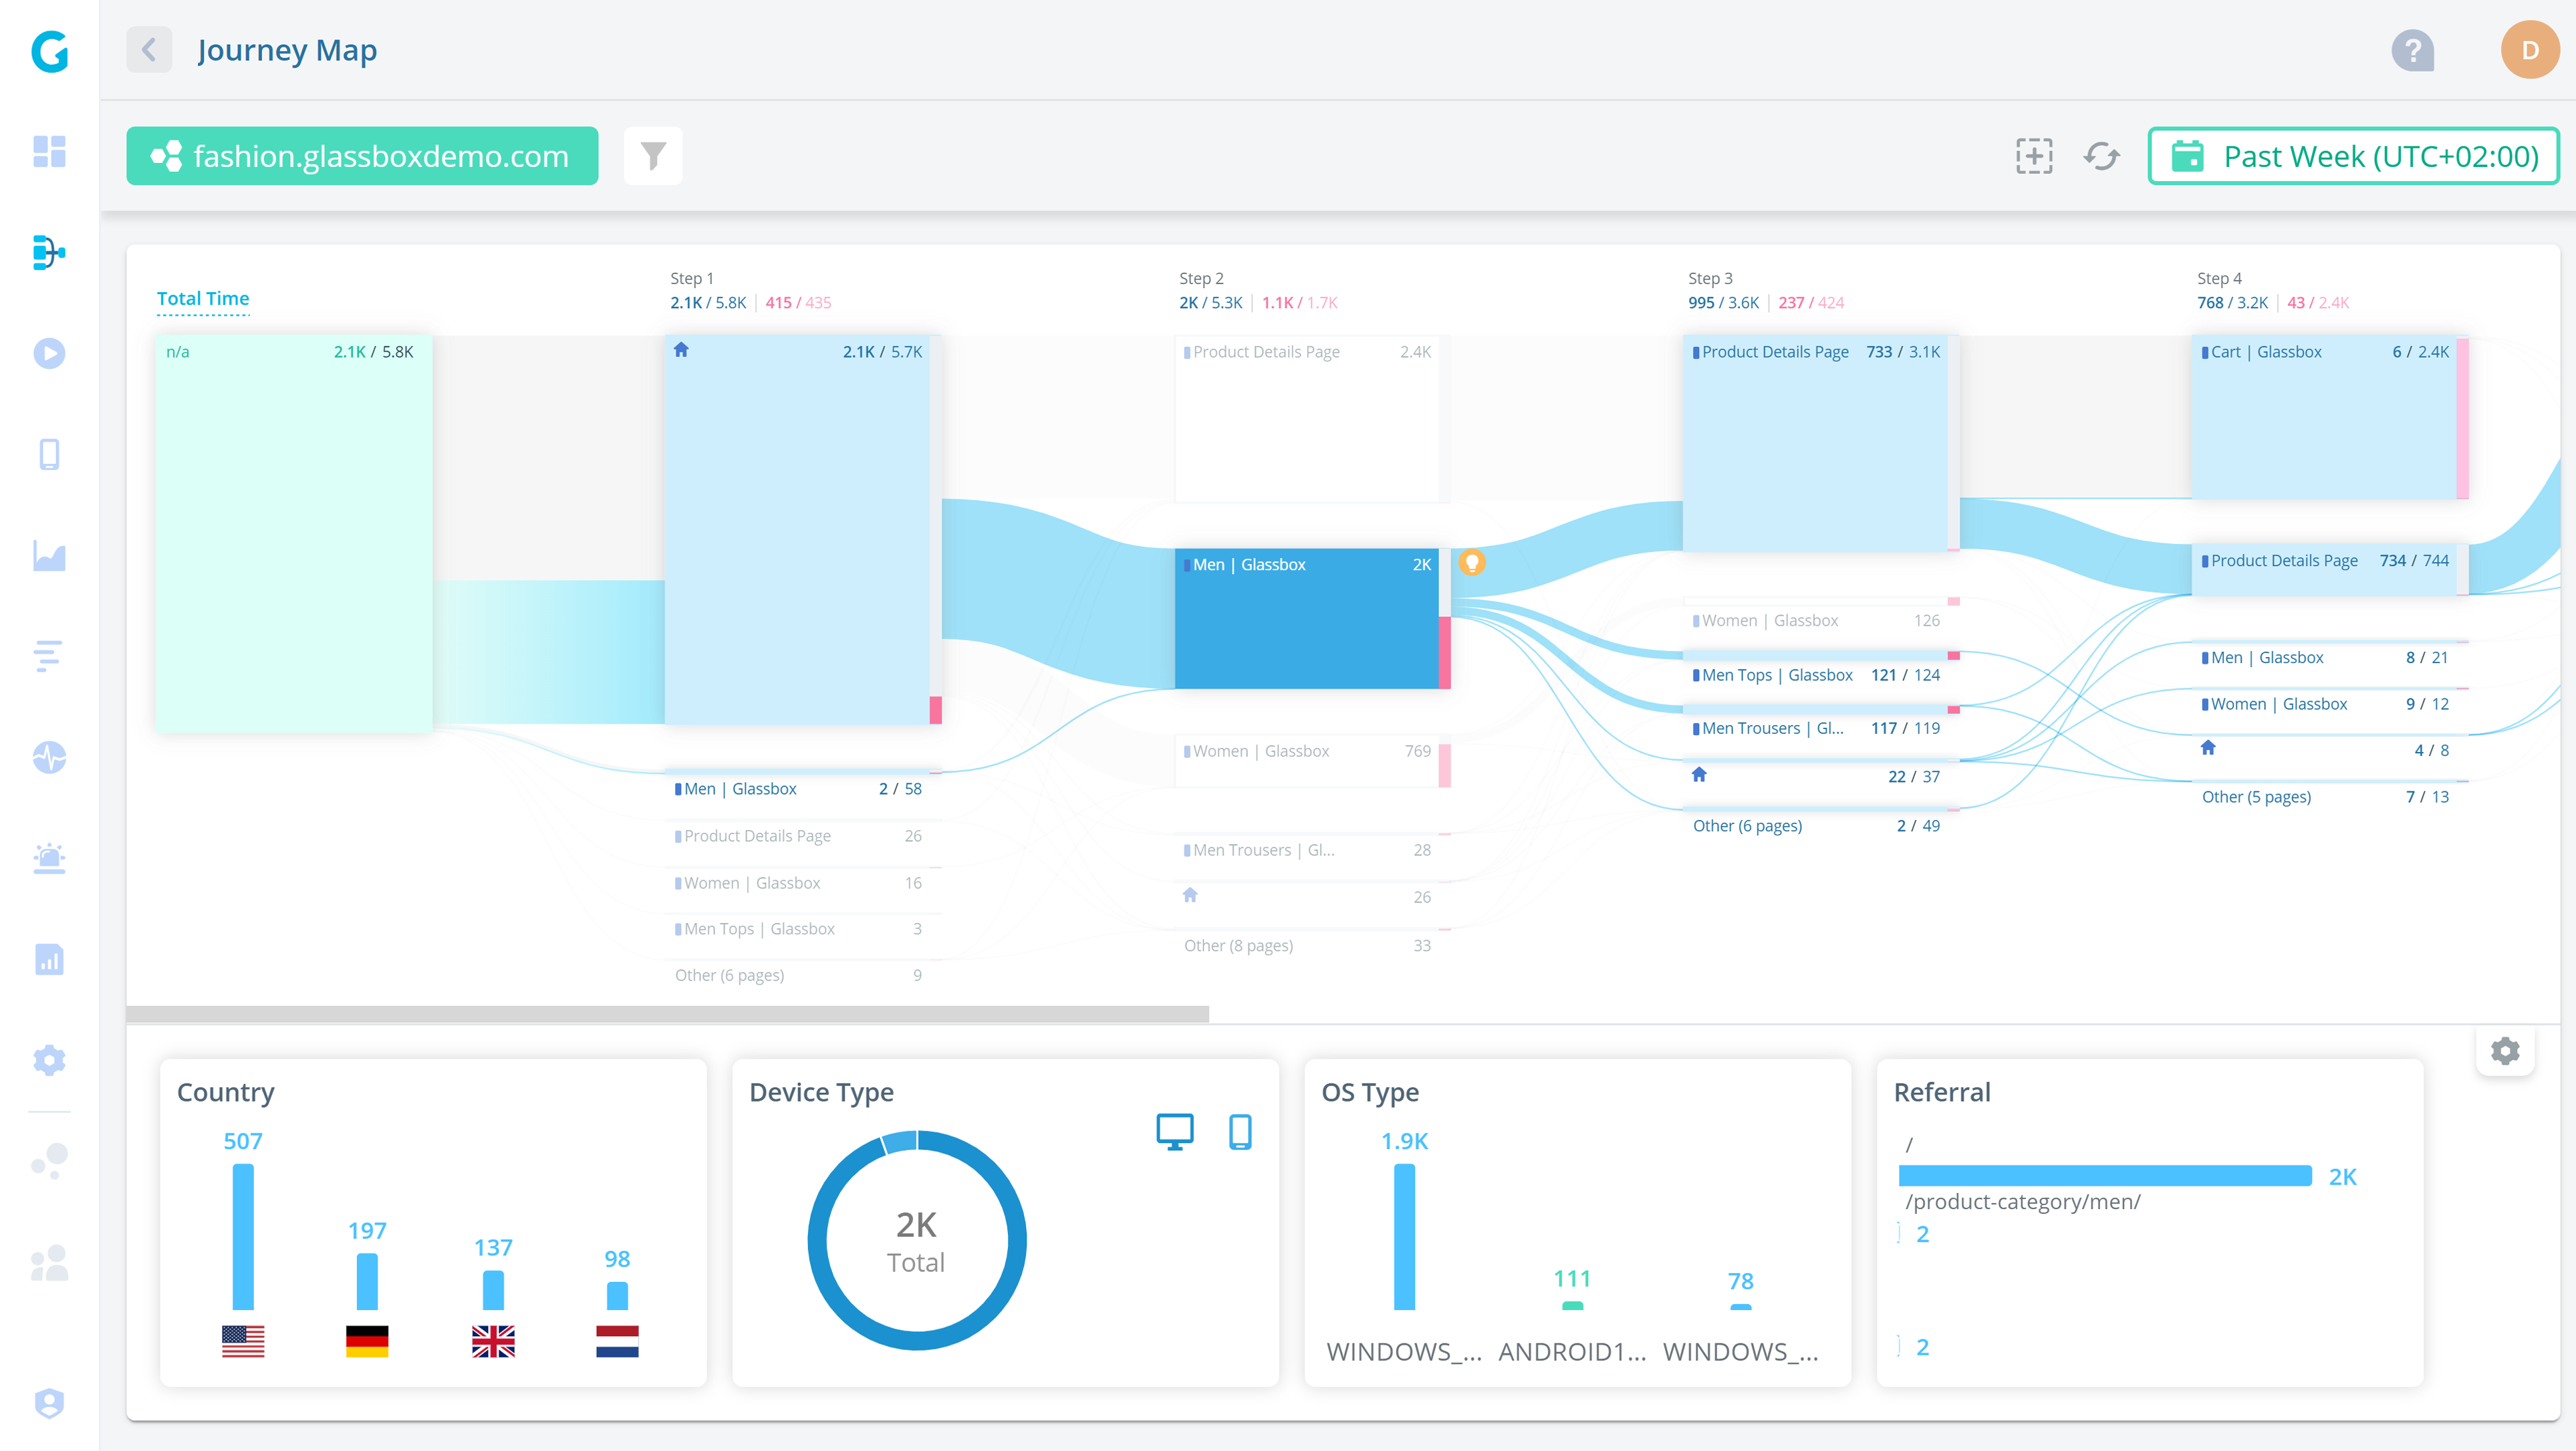
What is Glassbox?
Glassbox is a session replay and analytics platform with a particular focus on mobile apps, retail, and ecommerce use cases. Customers include UK retailer Sainsbury's, Marriott, and Experian.
Glassbox is predominantly used by business analysts and support teams in these companies.
Key features
Product analytics: Understand user paths and struggle points. Build custom dashboards and do cohort filtering.
Performance analytics: Track app performance like crash rate and its impact on conversion rates.
Session replay: Watch and analyze real user sessions on web and mobile apps.
Click, scroll, and heatmaps: Understand where users interact with your app. Do zone analysis and exposure tracking for specific segments.
User feedback: Gather satisfaction and user feedback on the app experience.
How does Glassbox compare to Amplitude?
A big downside of Glassbox is a lack of self-serve. Other than that, it is similar to Amplitude on the analytics side, with the bonus of a mobile focus and session replay.
Main differences between Glassbox and Amplitude
- Glassbox specializes in mobile apps and native mobile replay; Amplitude's mobile support is less emphasized.
- Glassbox targets retail, ecommerce, and financial services; Amplitude serves a broader range of industries.
- Amplitude includes A/B testing and feature flags; Glassbox lacks experimentation features.
- Glassbox has proprietary struggle detection for identifying user friction; Amplitude relies on standard funnel analysis.
Main similarities between Glassbox and Amplitude
- Both offer product analytics with funnels, paths, and cohort analysis.
- Both provide session replay and heatmaps for understanding user behavior.
- Both support feedback and survey collection.
- Both serve enterprise customers with compliance and security requirements.
Why do companies use Glassbox?
According to G2 reviews, customers use Glassbox for:
Session replay and error analysis: Glassbox is best known for its session replay features. This helps reviewers analyze user journeys and identify app-breaking bugs.
Heatmap and funnel analysis: Reviewers like the heatmaps feature, which enables them to see user preferences on key pages. They combine this with paths and funnels to see the entire journey.
Fixing low conversion and abandonment: Glassbox is popular among online retailers, who use it to solve issues with conversion and basket abandonment. Their struggle scores are a popular feature for figuring this out.
Bottom line
Not being able to try Glassbox without talking to sales hurts it as an alternative. There are likely better choices, especially if you want A/B testing, feature flags, or EU hosting.
6. LogRocket
- Founded: 2016
- Most similar to: PostHog, Smartlook
- Typical users: Product managers, engineers, support teams
- Typical customers: B2B SaaS, B2C retail companies.

What is LogRocket?
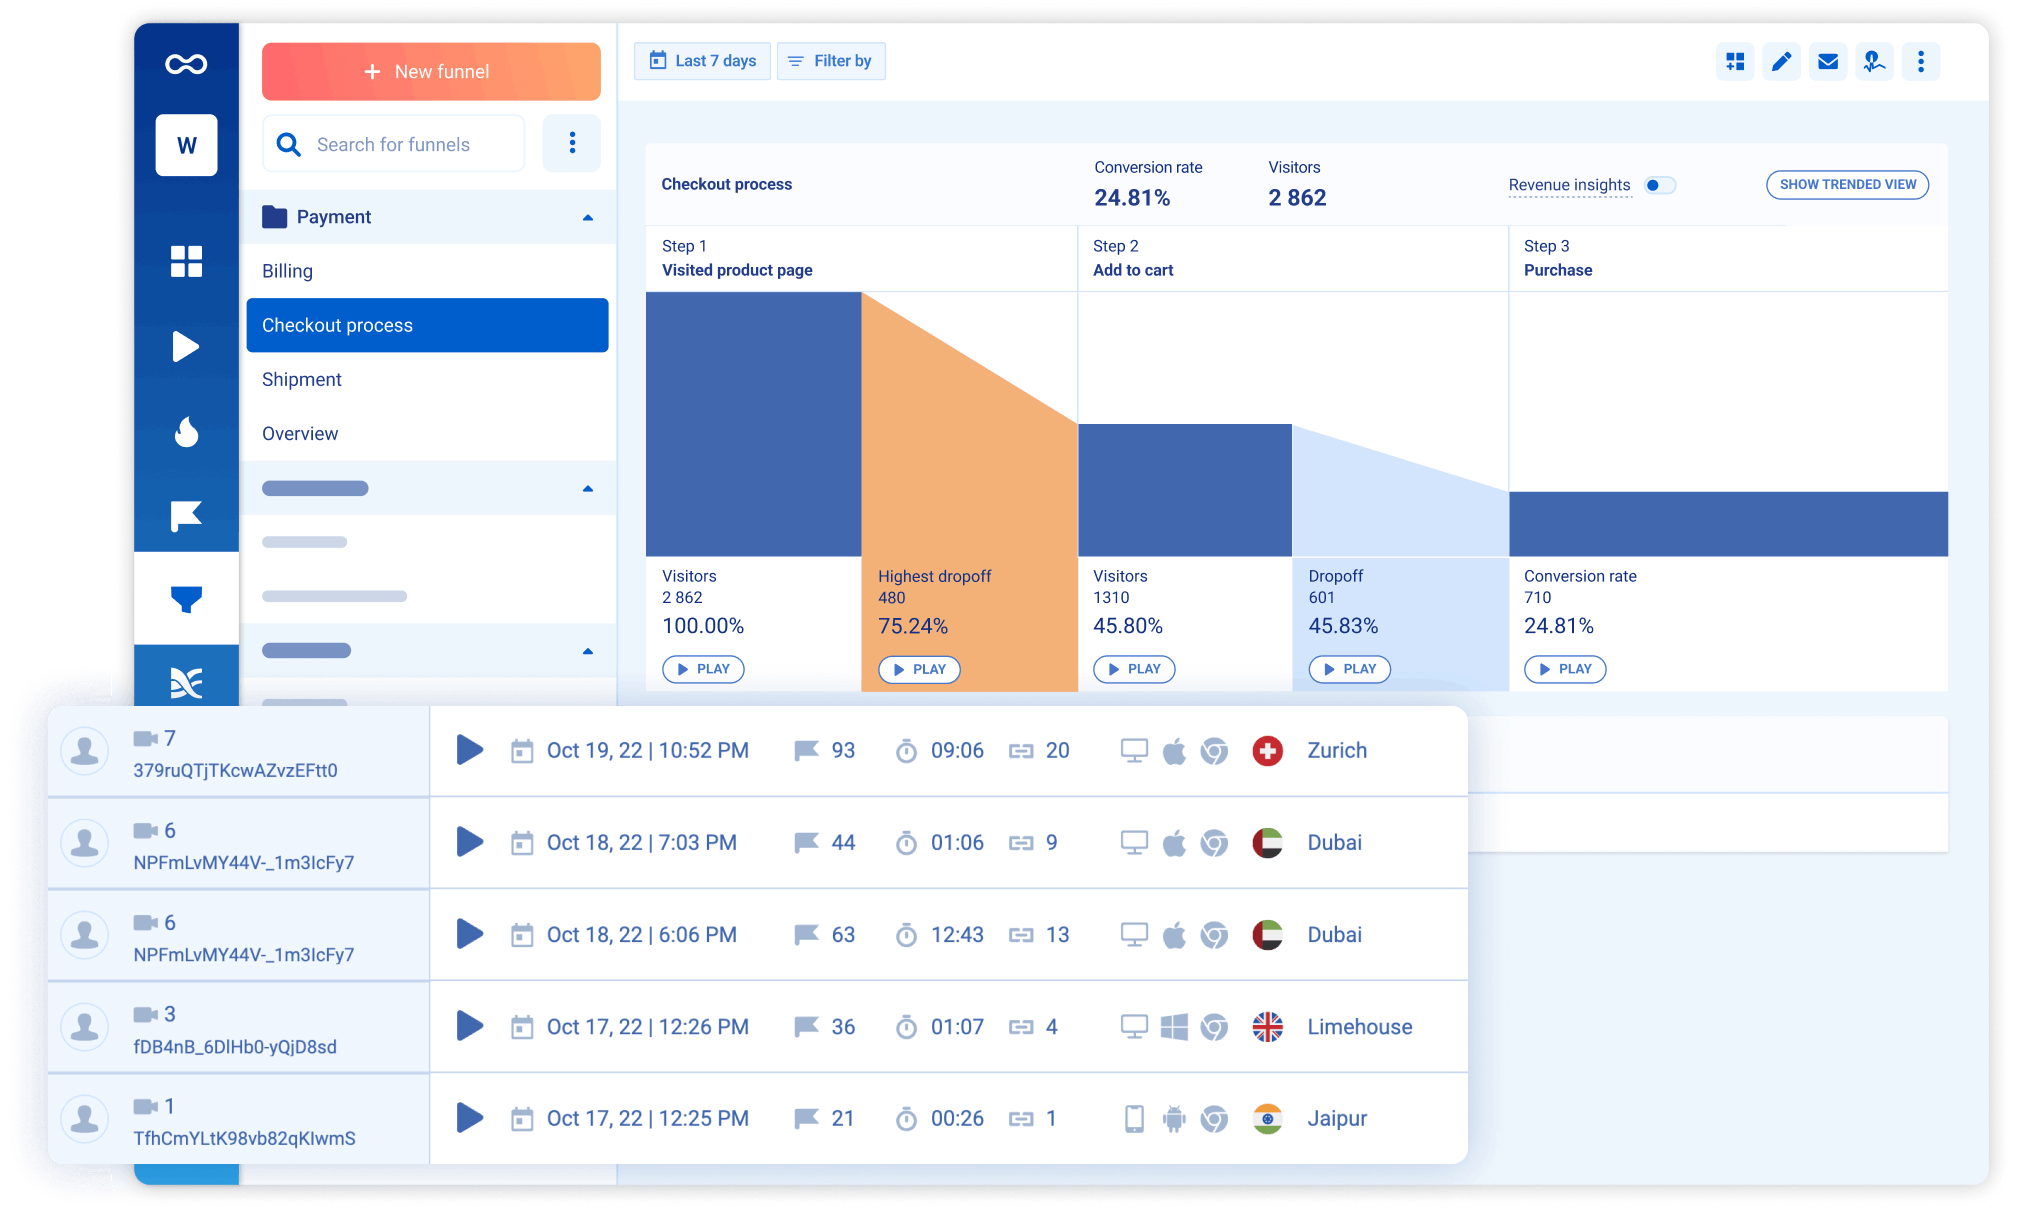
LogRocket is a product experience platform with product analytics, error tracking, session replay, and performance monitoring. It focuses on helping product managers, engineers, and support teams identify and fix issues.
Key features
Product analytics: Capture usage data and visualize it with conversion funnels, path analysis, and retention charts.
Error tracking: Identify and triage the most impactful issues with JavaScript and network errors as well as stack traces.
Performance monitoring: Monitor frontend performance such as web vitals, CPU and memory usage, and network speed.
Session replay: Understand exactly what users are doing on your site. See the screens they visit, places they click, as well as console and network logs, errors, and performance data.
Heatmaps: See what users are clicking on, where they are spending their time, and how far they scroll.
How does LogRocket compare to Amplitude?
Like many of the other alternatives, LogRocket lacks group analytics, A/B testing, and feature flags. It makes up for this by including performance monitoring and error tracking, which Amplitude doesn't include.
Main differences between LogRocket and Amplitude
- LogRocket includes JavaScript error tracking with stack traces; Amplitude has no error tracking.
- LogRocket monitors web vitals, CPU, memory, and network performance; Amplitude doesn't offer performance monitoring.
- Amplitude has deeper analytics with group analytics, SQL access, and warehouse-native queries; LogRocket's analytics are more basic.
- LogRocket is built for debugging and issue resolution; Amplitude focuses on behavioral analytics and growth.
Main similarities between LogRocket and Amplitude
- Both offer product analytics with funnels, retention, and user paths.
- Both provide session replay for understanding user behavior.
- Both include heatmaps for visualizing clicks and scroll depth.
- Both integrate with popular development and collaboration tools.
Why do companies use LogRocket?
The reviewers of G2 use LogRocket for these reasons:
Identifying problems: LogRocket's combination of error tracking, performance monitoring, and session replay makes it uniquely powerful at finding bugs and issues.
Improves user experience: LogRocket helps reviews fix issues with their apps. Reviewers find it provides all the tools to improve their user experience, mostly by solving what's wrong rather than feedback and planning.
High usability: LogRocket provides a lot of functionality out of the box. It captures the details users need, provides useful visualizations, and automatically triages some issues.
Bottom line
LogRocket is a solid alternative to Amplitude, especially if you want session replay, error tracking, and performance monitoring.
7. Smartlook
- Founded: 2016
- Most similar to: LogRocket, Glassbox, Heap
- Typical users: Engineers, business analysts, product managers
- Typical customers: Enterprise retail and ecommerce websites and apps
What is Smartlook?
Smartlook combines session replays with product analytics, visualizations, and crash reports to generate an overall understanding of user experience. It focuses more on mobile apps with specific tools like mobile heatmaps, native rendering, and wireframe mode.
Key features
Event-based analytics: See how often users behave in ways important to you such as URL visits, form submits, and clicks.
Funnels and paths: See how users move through your app with custom visuals for key flows.
Session recordings: Understand how users are actually using your app and where issues occur.
Heatmaps: Figure out what parts of the page users click on, move their mouse over, and scroll to. Overlay all this on your actual site.
Crash reports: Learn what happens before a crash without reproduction. Watch related session replay and manage crash triaging in Smartlook.
How does Smartlook compare to Amplitude?
Smartlook swaps Amplitude's A/B testing and feature flags for autocapture and session replay. Their core product analytics and platform features are very similar.
Main differences between Smartlook and Amplitude
- Smartlook specializes in mobile apps with native rendering, wireframe mode, and mobile heatmaps; Amplitude's mobile support is less specialized.
- Smartlook includes crash reporting tied to session replays; Amplitude has no crash or error tracking.
- Amplitude includes A/B testing and feature flags; Smartlook lacks experimentation features.
- Amplitude offers deeper analytics with group analytics, SQL access, and warehouse-native queries; Smartlook's analytics are more focused on behavior visualization.
Main similarities between Smartlook and Amplitude
- Both offer product analytics with funnels, paths, and retention analysis.
- Both support autocapture to reduce manual event instrumentation.
- Both are self-serve with free tiers available.
- Both offer EU data residency options.
Why do companies use Smartlook?
According to G2 reviewers, Smartlook users benefit from:
The integration between replays and events: Smartlook connects event-based analytics and real user sessions. This enables users to dive deeper into user behavior than a single tool would provide.
Understanding visitor pain points: The analytics and visualizations make it easy to understand where users are running into trouble or where crashes happen. Fixing these areas improves user experience and conversion.
Real user monitoring: See how real users are using your app and monitor the quality of their experiences. Figure out what areas are confusing or not being used properly.
Bottom line
Smartlook makes a good choice for an Amplitude alternative thanks to its matching product analytics features and being self-serve. For product teams, it misses out on group analytics but includes session replay which can help you understand specific experiences better.
8. Statsig
- Founded: 2021
- Most similar to: PostHog, Amplitude
- Typical users: Engineering and DevOps teams
- Typical customers: Engineering-focused B2B companies
What is Statsig?
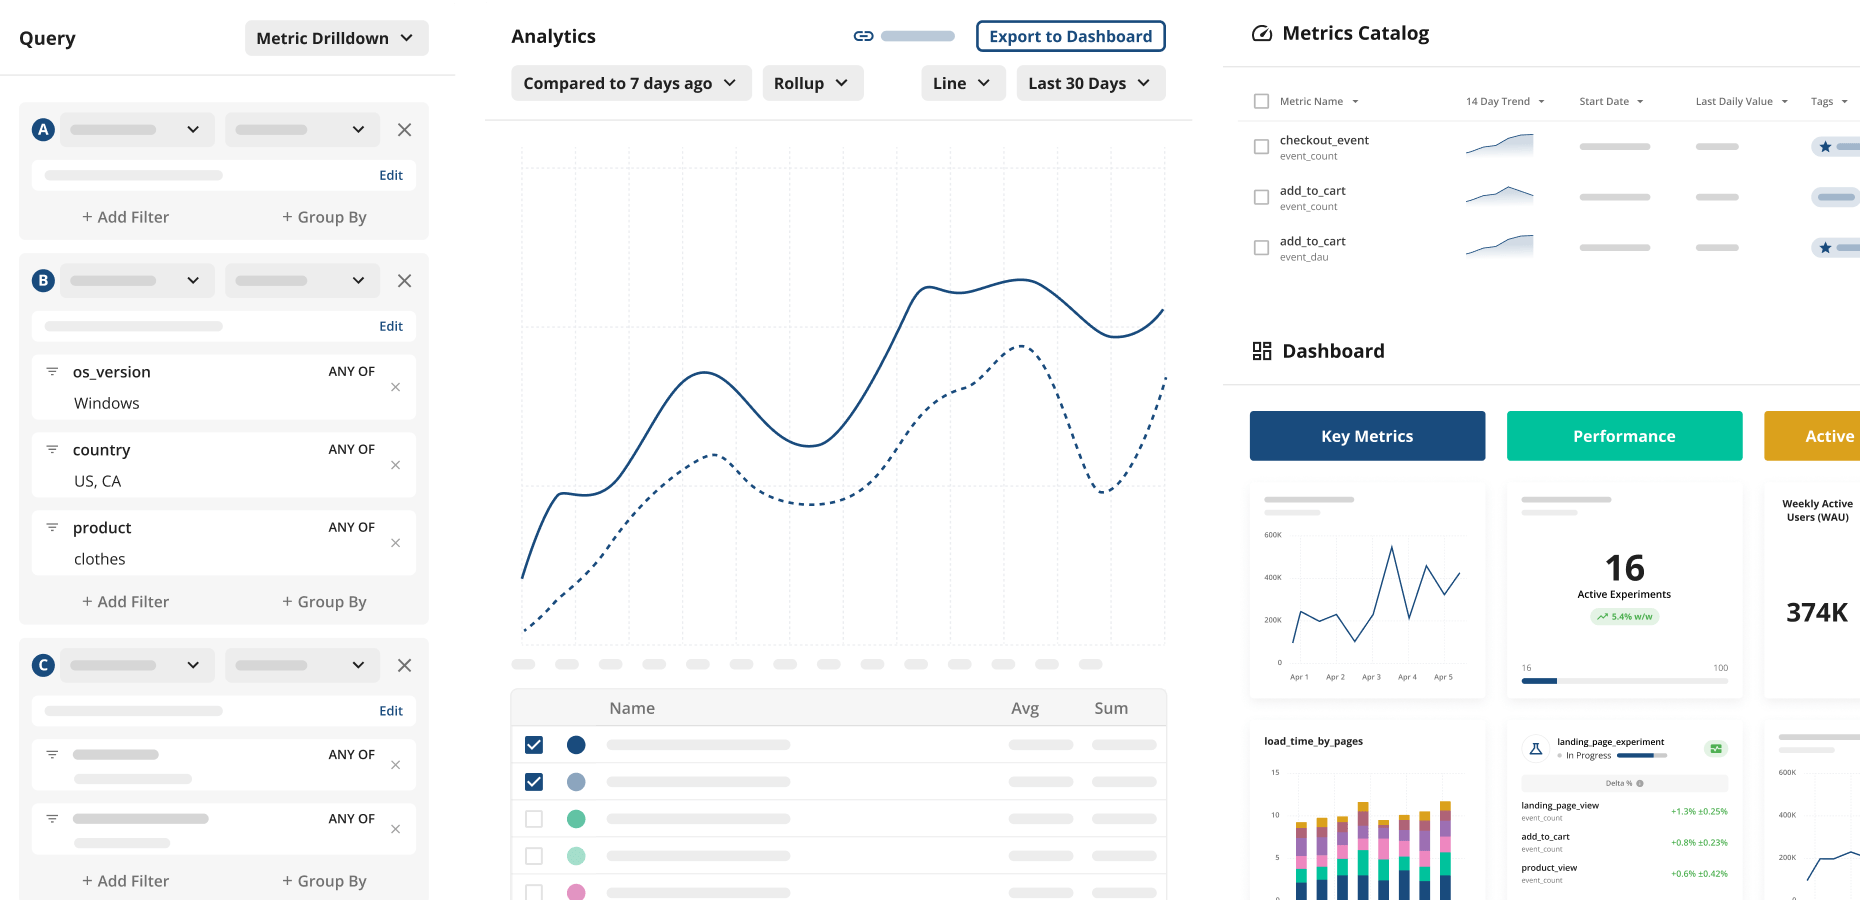
Statsig provides tools like experimentation, feature flags, and analytics to help companies build better products. Teams use it to take the risk out of releases, experiment with new features, and monitor changes.
It also includes a warehouse-native mode to connect directly and utilize your current data warehouse such as Snowflake or BigQuery.
Key features
- Experimentation: Measure the impact of new changes with frequentist and Bayesian analysis engines.
- Feature flags: Take the risk out of releases with targeted feature flag rollouts.
- Analytics: Provides a single location for your metrics. Enables users to dive deeper into them with trends, bar charts, and retention analysis.
- Data warehouse: Use Statsig with your existing data in your own warehouse. Generate insights and calculate impact using existing data.
How does Statsig compare to Amplitude?
Opposite to many of the alternatives on this list, Statsig focuses on A/B testing and feature flags. It does include basic analytics, but not nearly at the same level as Amplitude.
Main differences between Statsig and Amplitude
- Statsig is experimentation-first with basic analytics; Amplitude is analytics-first with experimentation included.
- Statsig offers more advanced experimentation features like CUPED variance reduction, sequential testing, and heterogeneous effect detection; Amplitude's experimentation is more basic.
- Amplitude has much deeper product analytics with funnels, cohorts, user paths, and SQL access; Statsig's analytics are more limited.
- Statsig publishes clear usage-based pricing; Amplitude's Growth/Enterprise pricing requires contacting sales.
Main similarities between Statsig and Amplitude
- Both offer A/B testing and feature flag functionality.
- Both support warehouse-native analytics (Snowflake, BigQuery, Databricks).
- Both provide SDKs for web and mobile platforms.
- Both are trusted by large-scale companies running experiments at volume.
Why do companies use Statsig?
According to G2, users are big fans of Statsig because:
Experiments-focused: It provides all the tools to run successful experiments. This enables reviewers to ship faster and create an experimentation mindset within their company.
Responsiveness: The Statsig team is responsive to user issues and concerns. Reviewers appreciate how helpful support is.
Documentation: Thanks to the solid documentation of SDKs and features, in combination with a simple UX, reviewers find Statsig easy to set up and use.
Bottom line
If your focus is experimentation and feature releases, Statsig can make for a solid alternative to Amplitude. It does miss out on the advanced analytics features when compared to Amplitude.
Which Amplitude alternative should you choose?
- Want an all-in-one developer platform with analytics, error tracking, feature flags, experiments, LLM analytics, surveys, and more, and transparent pricing? Go with PostHog.
- Need focused product analytics without extra features? Mixpanel keeps it simple.
- Looking for in-app guides, product tours, and roadmap tools? Pendo is built for product experience.
- Want comprehensive autocapture with minimal setup? Heap gets you started fast.
- Mobile-first with native app heatmaps and replay? Glassbox specializes here.
- Frontend debugging with error tracking and performance monitoring? LogRocket connects it all.
- Mobile crash reports tied to session replays? Smartlook focuses on mobile UX.
- Best-in-class experimentation and feature flags? Statsig is purpose-built for shipping.
Is PostHog right for you?
Here's the (short) sales pitch.
We're biased, obviously, but we think PostHog is the perfect Amplitude replacement if:
- You value transparency (we're open source and open core)
- You want tools to help you understand users in more depth (we added session replay, surveys, and more on top of Amplitude's feature set)
- You want to try before you buy (we're self-serve with a generous free tier)
Check out our product pages and read our docs to learn more.
Frequently asked questions
What is Amplitude used for?
Amplitude is a product analytics platform used to track user behavior, analyze conversion funnels, measure retention, and run A/B tests. Product, growth, and marketing teams use it to understand how users interact with their products and make data-driven decisions.
Why look for an Amplitude alternative?
Common reasons include: needing features Amplitude doesn't offer (like error tracking or LLM analytics), wanting more transparent usage-based pricing instead of MTU-based contracts, preferring a more developer-friendly or open-source platform, or simply wanting more features in one tool.
What's the best Amplitude alternative overall?
For most teams, PostHog is the best alternative. It includes everything Amplitude offers (product analytics, session replay, A/B testing, surveys) plus error tracking, LLM analytics, and feature flags – all with transparent pricing and a generous free tier.
Which Amplitude alternatives are open source?
PostHog is the only major open-source alternative on this list. Visit this guide for additional open source product analytics options.
Which alternative has the best free tier?
PostHog offers the most generous free tier: 1 million events, 5,000 session replays, and 1 million feature flag requests per month. Amplitude's free tier includes 10K MTUs and 1,000 session replays. Mixpanel offers 1 million events free but lacks session replay on free plans.
Which alternative is best for startups?
PostHog stands out for early-stage companies. Beyond the generous free tier, startups can apply for PostHog for Startups to get $50,000 in additional credits. The usage-based pricing also means you only pay for what you use as you scale, rather than committing to seat-based or MTU contracts upfront.
Which alternative is best for engineering teams?
PostHog and Statsig are both built with engineers in mind. PostHog offers SQL access for custom queries, a fully documented API, and SDKs for every major platform. Statsig excels at experimentation workflows that integrate into CI/CD pipelines. If your team values being able to dig into the code or wants direct access to the people building the product, PostHog's open-source nature and engineer-focused support model fit well.
Which alternative is best for A/B testing and experimentation?
Statsig is the best choice if experimentation is your primary focus – it offers advanced statistical methods like CUPED, sequential testing, and warehouse-native experiment analysis. PostHog is ideal if you want experimentation tightly integrated with the rest of your product stack, so you can instantly see how experiments impact funnels, replays, and error rates.
Which alternative is best for session replay?
PostHog and LogRocket both excel at session replay. PostHog's strength is connecting replays to the broader product context – you can jump from a funnel drop-off directly into a relevant replay, or see which feature flag variant a user was on. LogRocket adds performance monitoring and is particularly strong for debugging frontend issues with detailed network and console data.
Does Amplitude have error tracking?
No. Amplitude does not offer error tracking or crash reporting. If you need to monitor exceptions and stack traces alongside your analytics, consider PostHog (which ties errors to user sessions and feature flags), LogRocket (which connects errors to performance data), or Smartlook (which links crash reports to mobile session replays).
Does Amplitude have LLM analytics?
No. Amplitude does not offer LLM observability or AI analytics features. PostHog is currently the only analytics platform on this list that includes LLM analytics for tracking AI product usage, monitoring model performance, analyzing token costs, and debugging LLM interactions.
Can I use Amplitude with my data warehouse?
Yes. Amplitude offers warehouse-native analytics that can query data directly from Snowflake, BigQuery, and Databricks. Statsig and Mixpanel also offer strong data warehouse integrations. PostHog takes a different approach – it stores data in ClickHouse and lets you export to your warehouse, or query directly via SQL and the API.
What other analytics tools are available?
We've written comparison guides for many analytics categories. See our takes on the best Mixpanel alternatives, Heap alternatives, Google Analytics alternatives, and open source analytics tools.
PostHog is an all-in-one developer platform for building successful products. We provide product analytics, web analytics, session replay, error tracking, feature flags, experiments, surveys, LLM analytics, data warehouse, CDP, and an AI product assistant to help debug your code, ship features faster, and keep all your usage and customer data in one stack.